
Core Pinning & Avoiding Context-Switches
CPU sets and RT Threads in Linux

Motivation
There is a couple reasons why anyone would want to pin a thread to a CPU core and let it run uninterrupted by the kernel's scheduler. Reliability is probably the main one when for example there is a hard requirement for an application to always be responsive or make forward progress for some workload. Performance is another one. The application may need to have such low latency that it can't afford to pay the cost of multiple context-switches or CPU cache misses.
In general the Linux scheduler has good defaults that minimize thread migration between cores (and as a result CPU cache misses) but provides no guarantees for that behavior. Additionally, context switches are unavoidable. The default scheduler policy (see SCHED_OTHER here) tries to ensure fairness to all threads by keeping track of the time they spent on CPU and scheduling them accordingly to ensure that they all make progress. It wasn't until recently that the kernel can be finally compiled with CONFIG_PREEMPT_RT, a configuration flag that transforms it into a regular RTOS. The RTOS capabilities allow developers to have their application/thread run without any interruptions by the scheduler by setting its priority on the scheduler higher than all other threads.
Before the RT patches were merged into the mainline kernel, developers had the following ways to achieve this:
Compile the RT patches themselves or use a linux distribution that comes with precompiled kernel binaries that include those patches.
Setup cgroups externally in the environment so that one or more CPUs are reserved for their process or group of processes.
Change their threads’ scheduling policy from within the application's logic.
(2) and (3) are not complete solutions to the context-switch problem (i.e. they don't get rid of them 100%) but they are come very close. In this post I decided to try and make a toy prototype using approach (3) as it seems the most flexible of the approaches in terms of the setup. With that solution the application doesn't care whether its running on an RTOS, or whether the underlying OS supports cgroups. As long as the kernel version is 2.6.17 or newer it should theoretically work.
Setup & Initial Data
For this minimal experiment I set up a Linux VM with only two cores and wrote the following C program that I later compiled with -O0 to disable any compiler optimizations. I called the program preemptible.
#include <stdint.h>

int
main(void)
{
        uint64_t max = ((uint64_t)UINT32_MAX) << 6;
        for (uint64_t i = 0, j = 0; i < max; i++) {
                j++;
        }
        return 0;
}
The whole point of the above program is to compete for CPU time by doing computation that does not involve voluntarily yielding control to the kernel (i.e. sleep or issue any I/O). This way if we spawn multiple instances of this program the kernel will have no choice but to preempt threads itself.
Running 9 instances of this program at roughly the same time and launching htop on a separate terminal I saw the following:
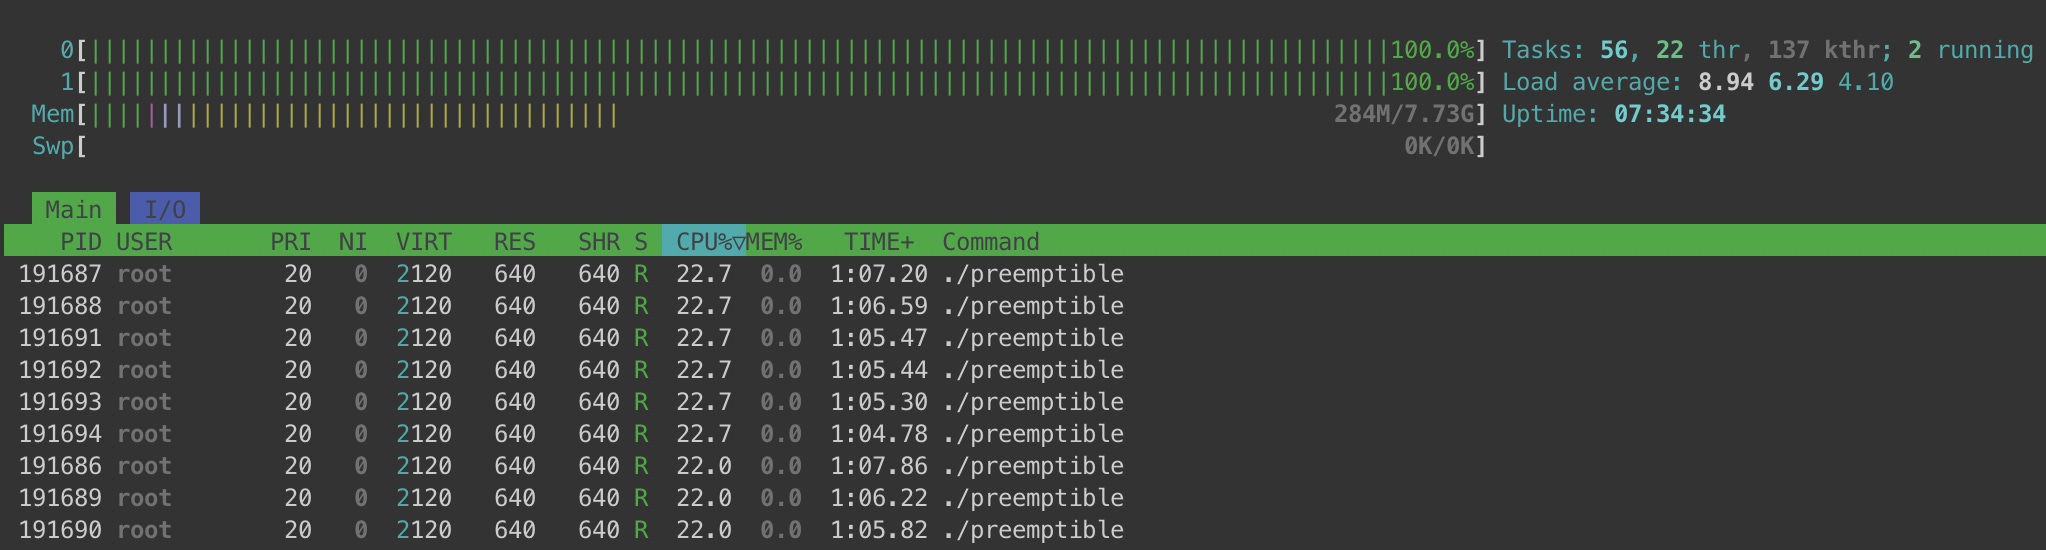
Both CPU cores were constantly running at 100% as different instances of preemptible were scheduled on them. The screenshot also shows that each instance would be running on a CPU core ~22% of the time which highlights the fairness aspect of the scheduler's default policy. What's even more interesting for this experiment is the statistics that perf stat gathered when I ran it on one of the preemptible instances.
root@beefy-coyote:/home/ubuntu/pin_cpu# perf stat ./preemptible

 Performance counter stats for './preemptible':

         128038.78 msec task-clock          #    0.225 CPUs utilized
             64210      context-switches    #  501.489 /sec
              1241      cpu-migrations      #    9.692 /sec
...<snip>...

     568.328236538 seconds time elapsed
     128.003040000 seconds user
       0.044002000 seconds sys
The interesting data points above are:
It took 568 seconds for
./preemptibleto finish since it was launched and it spent 128 seconds on CPU (thus the 0.225 CPUs utilized metric).It context-switch to the kernel 64120 times - 1241 of those times it was rescheduled on a different core.
Pin It And Let It Rip
I created a variant of preemptible, called non_premptible that looks like this:
#define _GNU_SOURCE
#include <sched.h>
#include <stdint.h>

#define CURRENT_THREAD 0

int
main(void)
{
        cpu_set_t set;
        CPU_ZERO(&set);
        CPU_SET(0, &set);
        sched_setaffinity(CURRENT_THREAD, sizeof(set), &set);

        struct sched_param sp = {
                .sched_priority = sched_get_priority_max(SCHED_FIFO);,
        };

        sched_setscheduler(CURRENT_THREAD, SCHED_FIFO, &sp);

        uint64_t max = ((uint64_t)UINT32_MAX) << 6;
        for (uint64_t i = 0, j = 0; i < max; i++) {
                j++;
        }
        return 0;
}
The above example has no error-handling for simplicity. The main point here is that we create an empty `cpu_set_t` and we add core #0 to the set with CPU_SET(), then we set the affinity of our program to that core through sched_setaffinity(). Finally we set the scheduling policy to SCHED_FIFO through sched_setscheduler() and assign its priority to the maximum possible value that we retrieve through sched_get_priority_max(). I highly recommend reading the SCHED_FIFO chapter of the sched(7) man page but for the hasty readers the relevant parts are copied below:
SCHED_FIFO can be used only with static priorities higher than 0, which means that when a SCHED_FIFO thread becomes runnable, it will always immediately preempt any currently running SCHED_OTHER, SCHED_BATCH, or SCHED_IDLE thread. SCHED_FIFO is a simple scheduling algorithm without time slicing.
...<snip>...
A SCHED_FIFO thread runs until either it is blocked by an I/O request, it is preempted by a higher priority thread, or it calls sched_yield(2).
Running non_preemptible alongside 8 instances of preemptible I see the following in htop:
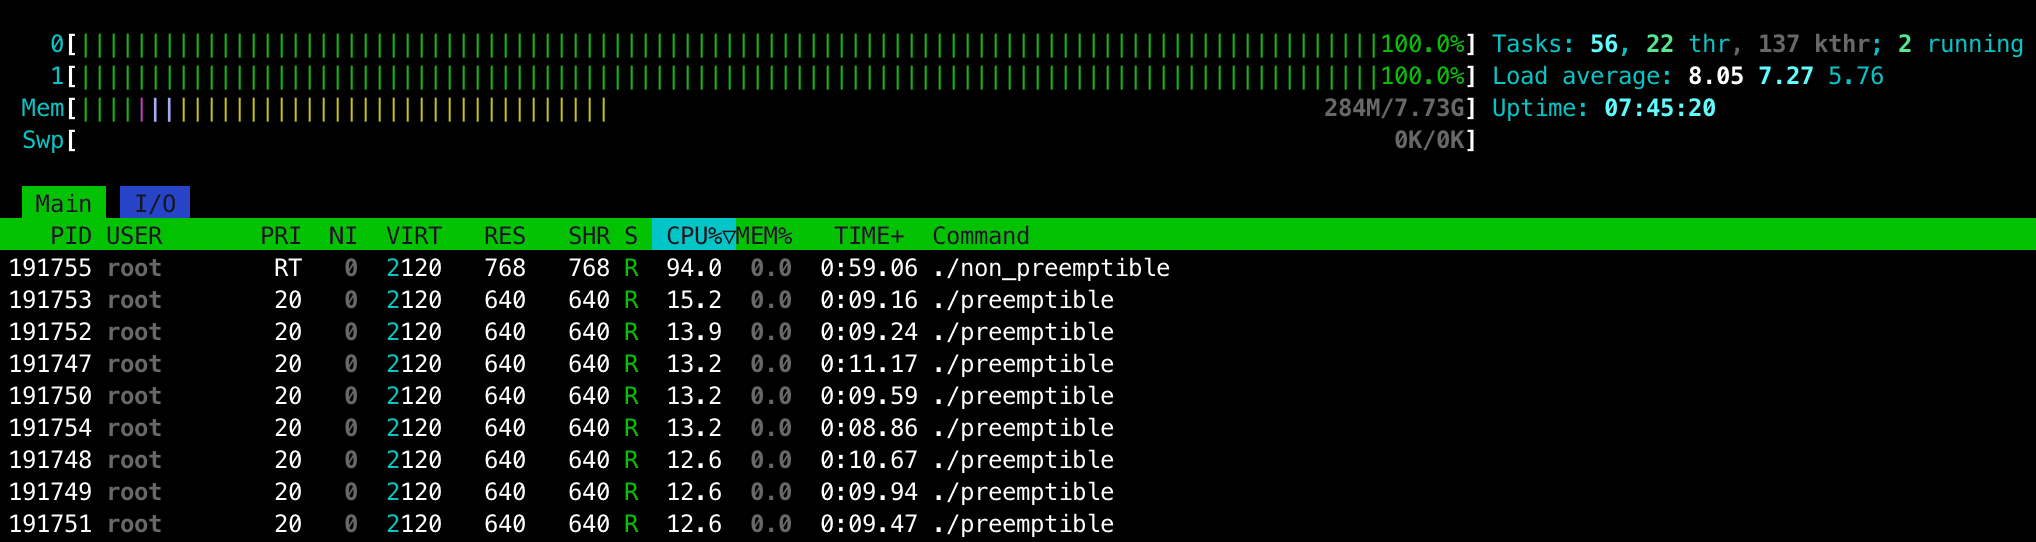
Immediately we see that non_preemptible hogs 94% of the CPU time and, while the preemptible instances have spent ~10 secs each on CPU, non_preemptible has spent 1 whole minute (as a result it also finished a lot earlier too).
Here's the perf stat output of non_preemptible in this experiment:
root@beefy-coyote:/home/ubuntu/pin_cpu# perf stat ./non_preemptible

 Performance counter stats for './non_preemptible':

         127566.08 msec task-clock          #    0.950 CPUs utilized
               166      context-switches    #    1.301 /sec
                 0      cpu-migrations      #    0.000 /sec
...<snip>...

     134.216953915 seconds time elapsed
     127.564287000 seconds user
       0.001998000 seconds sys
The above output shows that there were still some context-switches but there almost non-existent when you compare them to the `perf stat` output of preemptible (166 vs 64210). We also had 0 CPU migration during those 166 context switches and the time elapsed is very close to the task-clock/user time.
The last 5%
Even though the above is enough for most purposes the curious reader may be wondering why we still didn't get 100% utilization (and why are there still some context-switches here). There are many layers to this answer - the first one being the default values of some runtime tunables - specifically that of sched_rt_period_us and sched_rt_runtime_us. The former is set to 1,000,000 and specifies a scheduling period that is equivalent to 100% CPU bandwidth, which by itself means nothing. The later specifies how much of the sched_rt_period_us time can be used by all real-time threads on the system. By default it is set to 950,000 which means that all real-time threads are capped at 95% of CPU time leaving 5% for threads that are running in all other scheduler policies. See sched(7) for more info on these tunables. TL;DR; running the command below should get us closer to where we want to be:
echo 1000000 > /proc/sys/kernel/sched_rt_runtime_usor
echo -1 > /proc/sys/kernel/sched_rt_runtime_us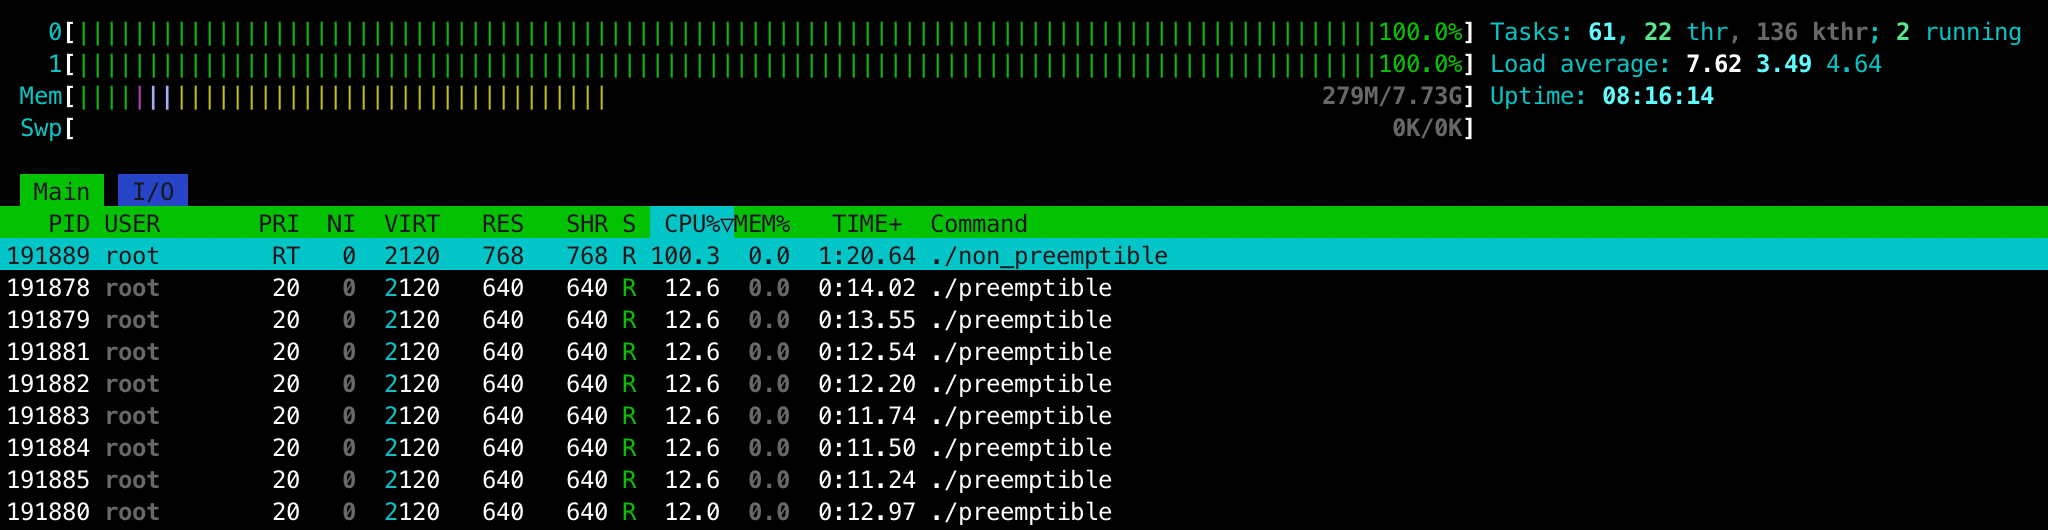
root@beefy-coyote:/home/ubuntu/pin_cpu# perf stat ./non_preemptible

 Performance counter stats for './non_preemptible':

         123407.28 msec task-clock           #    1.000 CPUs utilized
                31      context-switches     #    0.251 /sec
                 0      cpu-migrations       #    0.000 /sec
...<snip>...

     123.408499654 seconds time elapsed
     123.403286000 seconds user
       0.004000000 seconds sys
With that we get 100% CPU usage and the wall-clock time is almost identical to the user time. What's interesting is that there still seem to be some context-switches whose potential reasons of existence I believe to be the following:
They took place before we changed the scheduling policy to
SCHED_FIFO.There is some other process that run occasionally and somehow gets priority over
non_preemptible.There is some mechanism in the kernel that still needs our CPU for something
In any case I'm content with the depth of this rabbit-hole.
Appendix A: Pinned RT Thread Verification
In order to test that CPU pinning was indeed working as expected I created a variant program called non_preemptible1. The program is identical to non_preemptible but it gets pinned to CPU core #1 instead of #0. Running ./non_preemptible first I verified that it runs in core #0:
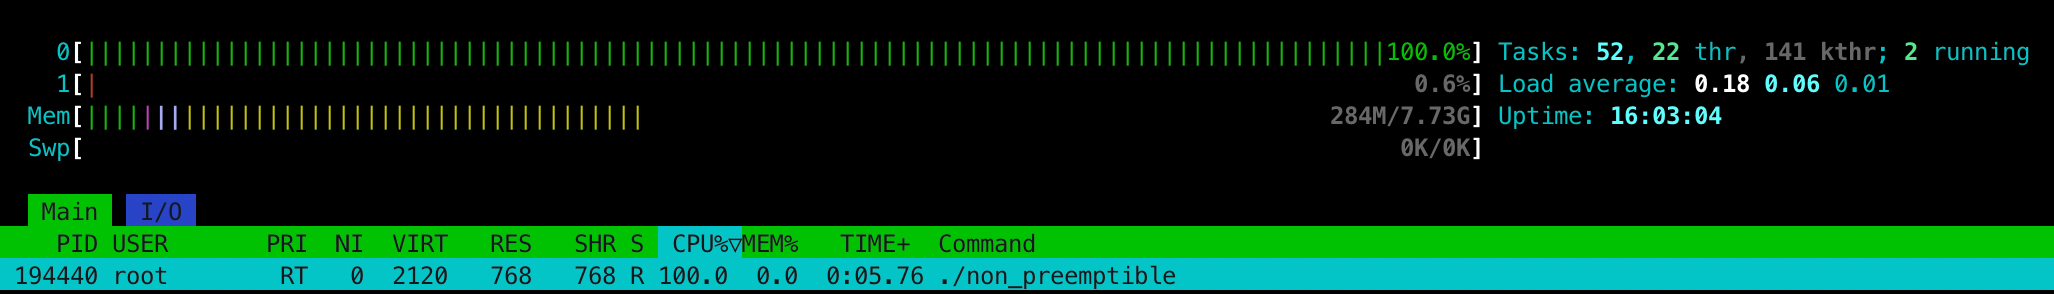
Once that's done, running ./non_preemptible1 I verified that it indeed ran in core #1 for the whole time:
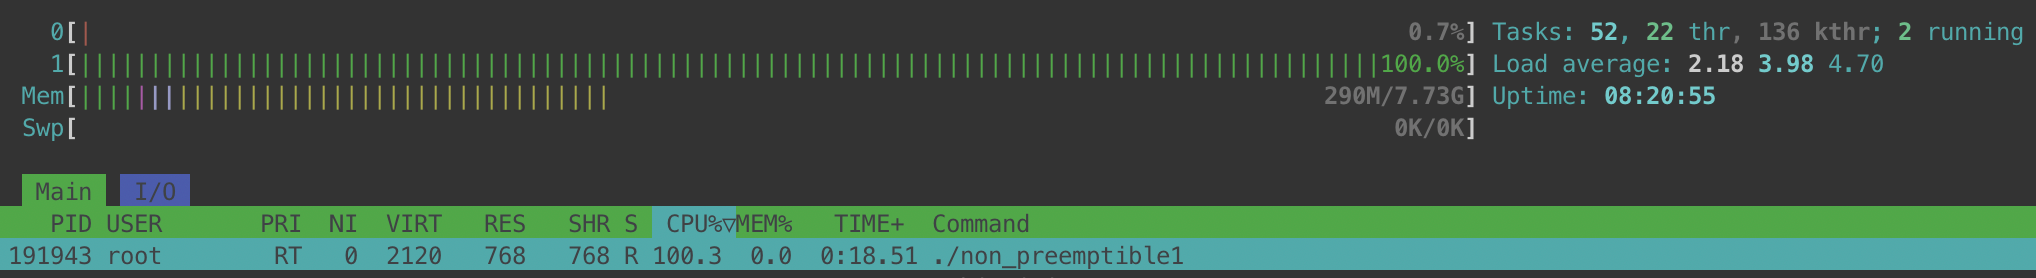
I finally ran both of them at the same time and my shell (including htop) froze until one of the non-preemptible threads finished. No surprises there :)